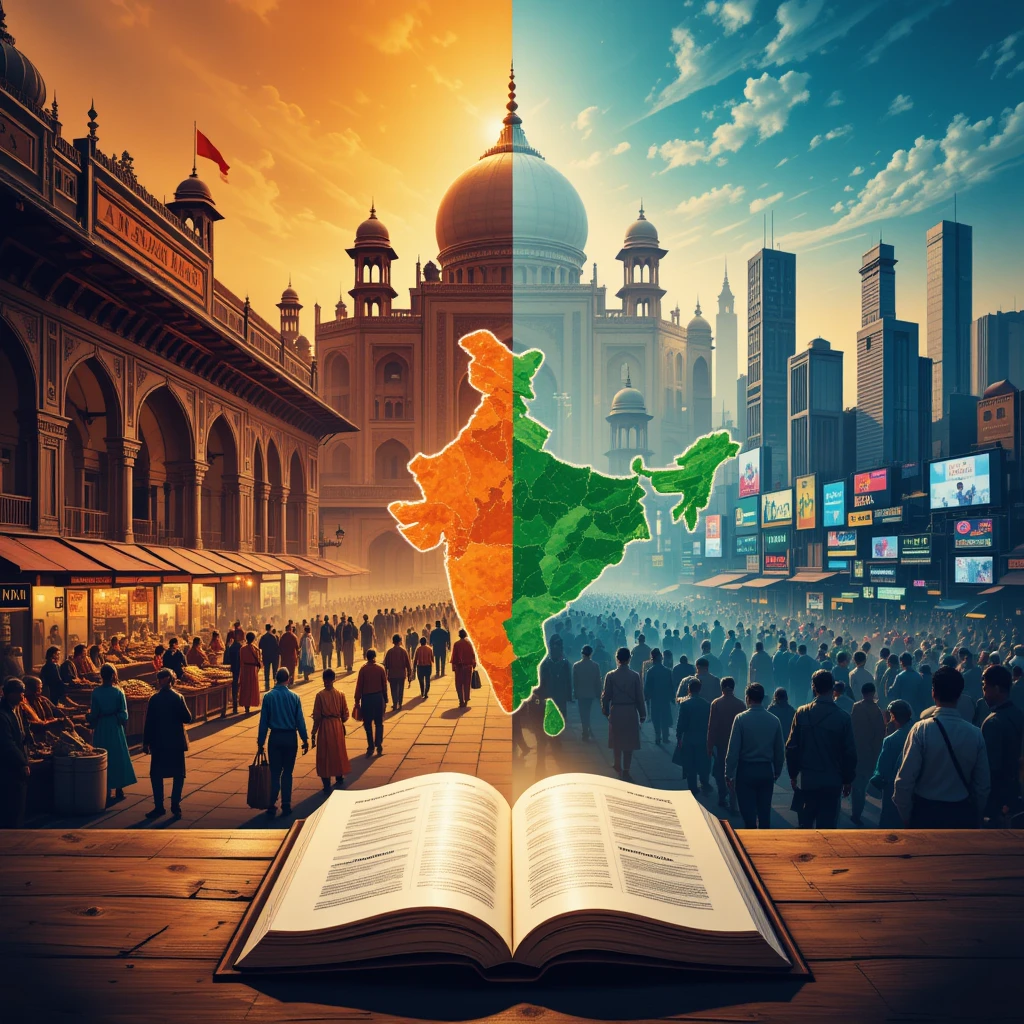
A detailed examination of Economic History of India’s economy from the Mughal era (1526–1857) to independence in 1947, followed by a comparative analysis of the economies of India and Pakistan from 1947 to the present, with a focus on GDP and per capita income. The article incorporates verified references, addresses potential inaccuracies, and ensures clarity and precision in economic data. All monetary values are presented in consistent terms (where possible, in nominal USD or 1990 international dollars for historical comparisons), and the analysis avoids speculative projections beyond available data.

Table of Contents
Part I: The Economy of India from Mughal Times to Independence
The Mughal Economy (1526–1857)
The Mughal Empire, at its zenith in the 17th century, was a global economic powerhouse, contributing an estimated 24.4% of world GDP in 1700, according to economic historian Angus Maddison. The economy was characterized by:
- Agrarian Dominance: Agriculture formed the core of the economy, contributing over 70% of national income. Mughal agrarian innovations, such as the use of the seed drill and crop rotation, resulted in agricultural productivity surpassing that of contemporary Europe in per capita terms (Broadberry et al., 2014). Key crops included rice, wheat, and cotton.
- Trade and Commerce: The Mughal Empire was integrated into global trade networks, exporting textiles (cotton and silk), spices, and precious stones. Cities like Surat, Dhaka, and Agra were major trade hubs. The empire’s coined currency system (gold mohurs, silver rupees, and copper dams) and free coinage facilitated robust internal and external trade.
- Manufacturing: India’s textile industry was globally renowned, with fine muslins and calicoes dominating markets in Europe and Asia. Shipbuilding and metallurgy also thrived, with Mughal artisans producing high-quality goods.
However, economic decline began in the 18th century due to political fragmentation and invasions. Per capita income, estimated at $682 in 1600 (1990 international dollars), fell to $569 by 1800, reflecting regional disparities. For instance, southern regions like Mysore maintained higher per capita incomes compared to northern areas affected by Mughal decline (Broadberry et al., 2014).
Reference: Maddison, A. (2001). The World Economy: A Millennial Perspective. OECD; Broadberry, S., Bishnupriya, G., & Custodis, J. (2014). India and the Great Divergence.
The East India Company Period (1757–1857)
The British East India Company’s (EIC) control, starting with the Battle of Plassey in 1757, marked a period of economic exploitation:
- Deindustrialization: The EIC’s policies favored British manufacturing, particularly cotton textiles, leading to the decline of India’s handicraft industries. By the 1830s, British cotton goods captured a significant share of the Indian market, reducing India’s textile exports. By 1875, British imports accounted for 55% of India’s textile market.
- Land Revenue Systems: The Permanent Settlement (1793) in Bengal and other revenue systems like Ryotwari and Mahalwari imposed heavy taxes, often requiring 50% of agricultural output. This limited investment in irrigation and infrastructure, stifling agrarian growth.
- Economic Drain: The EIC extracted wealth through taxes, tributes, and monopolistic trade practices. The Bengal famine of 1770, which killed an estimated 10 million people (one-third of Bengal’s population), was exacerbated by EIC policies that prioritized revenue over food security.
- Per Capita Income Stagnation: According to Maddison, India’s per capita income stagnated between 1757 and 1857, while Britain’s doubled. By 1820, India’s share of global GDP had declined to 16%, and by 1870, it was 12%.
Reference: Roy, T. (2010). Economic History of India, 1857–1947. Oxford University Press; Maddison, A. (2001).
The British Raj (1858–1947)
Following the 1857 Indian Rebellion, the British Crown assumed direct control, ushering in the British Raj. This period saw limited modernization but continued economic exploitation:
- Infrastructure Development: The British built extensive railway (over 40,000 miles by 1947) and telegraph networks, primarily to facilitate resource extraction and military control. While railways connected markets, they prioritized colonial interests over local needs.
- Deindustrialization: India’s share of global industrial output fell from 25% in 1750 to 2% by 1900. Traditional industries like textiles and metallurgy collapsed, though modern industries (e.g., cotton mills in Bombay) emerged under Indian entrepreneurs.
- Economic Drain: Wealth transfers to Britain, including Home Charges (administrative and military costs), drained India’s resources. Maddison estimates India’s global GDP share fell to 3.8% by 1952.
- Poverty and Famines: Per capita income remained low, estimated at $617 in 1947 (1990 international dollars). The 1943 Bengal famine, which killed 1.5–3 million people, highlighted colonial neglect, with grain exports continuing despite local shortages.
- Economic Indicators in 1947: India’s GDP was approximately ₹2.7 lakh crore (nominal), with a population of 340 million, a literacy rate of 12%, and a life expectancy of 32 years. Agriculture accounted for over 50% of GDP.
Reference: Roy, T. (2010); Maddison, A. (2001); Sen, A. (1981). Poverty and Famines.
Part II: Comparative Economic Analysis of India and Pakistan (1947–2025)
Economic Context at Independence (1947)
The partition of British India in 1947 created India and Pakistan, both inheriting underdeveloped economies reliant on agriculture. Partition caused massive displacement (12–14 million refugees) and economic disruption, particularly in Punjab and Bengal.
- India: In 1947, India’s GDP was approximately $213.7 billion (1990 international dollars), with a per capita income of $265 (nominal). Agriculture contributed over 50% of GDP, and the industrial base was limited.
- Pakistan: Pakistan’s economy was smaller but benefited from East Pakistan’s jute exports. Its per capita GDP was approximately 4% higher than India’s in 1950, estimated at $276 (nominal). Agriculture dominated, with limited industrial infrastructure.
Reference: Maddison, A. (2001); Economic History of India (Wikipedia).
Economic Trajectories (1947–1991)
India (1947–1991)
India adopted a socialist, state-led development model under Prime Minister Jawaharlal Nehru, emphasizing self-reliance:
- License Raj: The Industrial Policy Resolution of 1948 and subsequent policies restricted private enterprise through licensing and quotas, leading to inefficiencies. The public sector dominated heavy industries like steel and power.
- Five-Year Plans: Launched in 1951, these plans prioritized infrastructure, dams, and heavy industries. GDP growth averaged 3.5–4% annually (the “Hindu rate of growth”), a marked improvement over colonial stagnation (1%).
- Green Revolution: In the 1960s, high-yielding seeds, fertilizers, and irrigation increased agricultural output by 70% in states like Punjab. Food grain production rose from 50 million tonnes in 1950 to 130 million tonnes by 1990.
- Challenges: Protectionist policies, a fixed exchange rate, and bureaucratic inefficiencies led to foreign exchange crises (e.g., 1966 devaluation). Per capita GDP growth averaged 1.6% annually, reaching $370 by 1990.
Reference: Panagariya, A. (2008). India: The Emerging Giant. Oxford University Press.
Pakistan (1947–1991)
Pakistan’s economy experienced early growth but faced structural challenges:
- Early Growth: From 1961 to 1980, GDP growth averaged 6%, driven by foreign aid and East Pakistan’s jute exports. Per capita GDP was 24% higher than India’s in 1980 ($460 vs. $370).
- 1971 War and Bangladesh: The loss of East Pakistan (70% of export earnings) after the 1971 war disrupted Pakistan’s economy. GDP growth slowed, and political instability worsened.
- Foreign Aid Dependency: Pakistan relied on US and West Asian aid, which fueled growth but delayed reforms. High defense spending (often 6–7% of GDP) limited social investments.
- Per Capita Income: By 1990, Pakistan’s per capita GDP was roughly equivalent to India’s at $370, reflecting slower growth post-1971.
Reference: Zaidi, S. A. (2015). Issues in Pakistan’s Economy. Oxford University Press.
Economic Liberalization and Beyond (1991–2025)
India (1991–2025)
The 1991 balance of payments crisis, with foreign reserves covering only two weeks of imports, forced India to liberalize its economy:
- Reforms: Under Finance Minister Manmohan Singh, India reduced trade barriers, deregulated industries, and encouraged foreign direct investment (FDI). The License Raj was dismantled, spurring private sector growth.
- GDP Growth: GDP growth accelerated to 6–7% annually in the 2000s. By 2022, India’s nominal GDP was $3.39 trillion, and by 2025, it is estimated at $4.1 trillion, making India the fourth-largest economy (IMF projections).
- Per Capita Income: Per capita GDP rose from $442 in 2000 to $2,711 in 2024 (nominal). In PPP terms, it was $9,664 in 2023, reflecting higher purchasing power.
- Sectoral Shift: The service sector (IT, finance, and telecom) grew to nearly 60% of GDP by 2025, while agriculture’s share fell to 16%. Manufacturing remained stable at 13–15%.
- Challenges: Despite growth, income inequality and low per capita income (compared to Thailand’s $7,182 in 2023) persist. Unemployment and infrastructure gaps remain concerns.
Reference: IMF World Economic Outlook (2024); Panagariya, A. (2008).
Pakistan (1991–2025)
Pakistan’s economic performance lagged due to structural and political challenges:
- Slow Growth: GDP growth averaged 4% in the 2000s but fell to 2.5% by 2023. Nominal GDP in 2022 was $376.53 billion, about one-ninth of India’s.
- Per Capita Income: Per capita GDP grew from $733 in 2000 to $1,581 in 2024, significantly trailing India’s $2,711. In 2023, India’s per capita income was 1.85 times Pakistan’s.
- Economic Crises: High inflation (23.4% in 2024), external debt (86.8% of GDP), and reliance on IMF bailouts (23rd program since 1958) strained the economy. Political instability, including four military coups, and terrorism deterred FDI.
- Sectoral Composition: Industry and services grew, but agriculture remains significant (22% of GDP). Pakistan lacks a robust IT sector, unlike India.
Reference: IMF World Economic Outlook (2024); Zaidi, S. A. (2015).
Comparative Per Capita Income (1947–2025)
| Year | India Per Capita GDP (USD, Nominal) | Pakistan Per Capita GDP (USD, Nominal) | Notes |
|---|---|---|---|
| 1950 | ~265 | ~276 | Pakistan’s slight edge due to jute exports. |
| 1960 | ~330 | ~300 | India surpassed Pakistan. |
| 1980 | ~370 | ~460 | Pakistan led by 24%. |
| 1990 | ~370 | ~370 | Convergence due to Pakistan’s post-1971 slowdown. |
| 2000 | 442 | 733 | Pakistan maintained a lead. |
| 2010 | ~1,400 | ~1,000 | India overtook Pakistan. |
| 2018 | ~2,010 | ~1,470 | India’s lead widened. |
| 2024 | 2,711 | 1,581 | India’s per capita income 1.85x Pakistan’s. |
Source: Maddison (2001); IMF World Economic Outlook (2024); World Bank.
Key Factors Explaining Divergence
- Political Stability: India’s democratic continuity, despite challenges, enabled consistent policy implementation. Pakistan’s four military coups and frequent government changes disrupted economic planning.
- Economic Reforms: India’s 1991 liberalization attracted FDI and boosted growth, while Pakistan’s delayed and inconsistent reforms limited progress.
- Defense Spending: Pakistan’s defense expenditure (6–7% of GDP historically) outpaced India’s (2–3%), diverting resources from development.
- Sectoral Development: India’s IT and service sector boom, coupled with the Green Revolution, drove growth. Pakistan’s loss of East Pakistan and failure to develop a similar sector hindered progress.
Conclusion
India’s economy evolved from a prosperous Mughal system to a stagnating colonial economy, with its global GDP share falling from 24.4% in 1700 to 3.8% by 1952 due to British exploitation. Post-1947, India and Pakistan started with similar economic conditions, but India’s stable democracy, 1991 reforms, and sectoral diversification propelled it to a $4.1 trillion economy by 2025, with a per capita GDP of $2,711. Pakistan, constrained by political instability, debt, and limited reforms, has a $376 billion economy and a per capita GDP of $1,581. While India faces challenges like inequality, its economic trajectory is robust, whereas Pakistan requires structural reforms to address chronic crises.
References
- Maddison, A. (2001). The World Economy: A Millennial Perspective. OECD.
- Broadberry, S., Bishnupriya, G., & Custodis, J. (2014). India and the Great Divergence. Economic History Review.
- Roy, T. (2010). Economic History of India, 1857–1947. Oxford University Press.
- Sen, A. (1981). Poverty and Famines. Oxford University Press.
- Panagariya, A. (2008). India: The Emerging Giant. Oxford University Press.
- Zaidi, S. A. (2015). Issues in Pakistan’s Economy. Oxford University Press.
- IMF World Economic Outlook (October 2024).
- World Bank Data (2023–2024).
- Economic History of India (Wikipedia, accessed July 2025).
- India vs Pakistan: A tale of two economies (Business Today, 2023).
- India’s GDP Per Capita Since Independence (Carnegie Endowment, 2022).


